Game drive emissions
kgCO₂e / guest bed night
Your property7.4
Comparable off-grid safari lodges10.1
Illustrative ETC Africa benchmark comparison

Environmental performance for tourism
We help tourism businesses work out where they stand, how they compare, what needs attention and what to do next. We stay involved as the picture develops, helping you track progress, train your team and back up what you say with real evidence.
Game drive emissions
kgCO₂e / guest bed night
Built for tourism Independent lodges · Hotels · Safari operators · Multi-property groups · Tourism portfolios
What we actually help with
A carbon footprint gives you a starting point. We help you understand what the numbers mean, what deserves attention and what to do next.
Know where you are.
Build a credible picture of your carbon and environmental performance using the information your business already has.
See how you compare.
Use relevant tourism benchmarks to understand what the numbers mean in context.
Work out what matters.
Find unusual patterns, practical opportunities and the areas where effort or investment can make the biggest difference.
See whether things are getting better.
Follow performance over time, improve the quality of the data and keep important actions moving.
Give your people useful skills.
ETC clients and Verified Impact participants get access to practical online learning designed for tourism teams — from guides and guest-facing staff through to operations, finance and reporting teams.
Back up what you say.
Turn real performance data into credible information for management, guests, agents, tour operators and marketing teams.
Practical online learning is designed for different roles — from the people talking to guests to the people collecting and reporting the data, building more knowledge inside the business over time.
The first assessment gives us the baseline. From there, we help you follow what changes, investigate unusual results, improve the data and keep important actions moving.
A measurable foundation
Carbon measurement connects energy, fuel, travel, waste and operations into a useful picture of how the business is performing.
Why context matters
Two different tourism operations and two different footprints. The lower number does not automatically mean better performance.
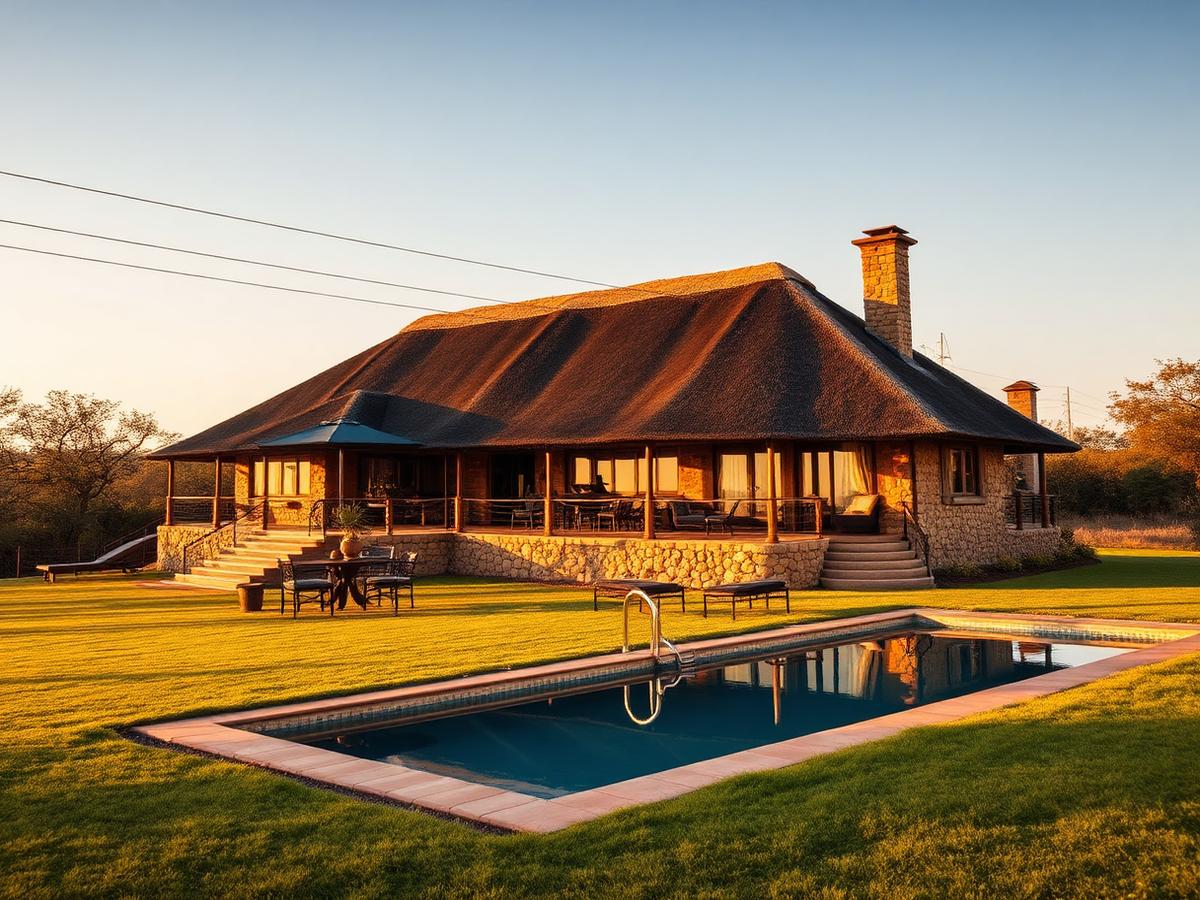
Lodge A
Grid-connected · easily accessible · 24 beds
6.4 kgCO₂e / guest bed night
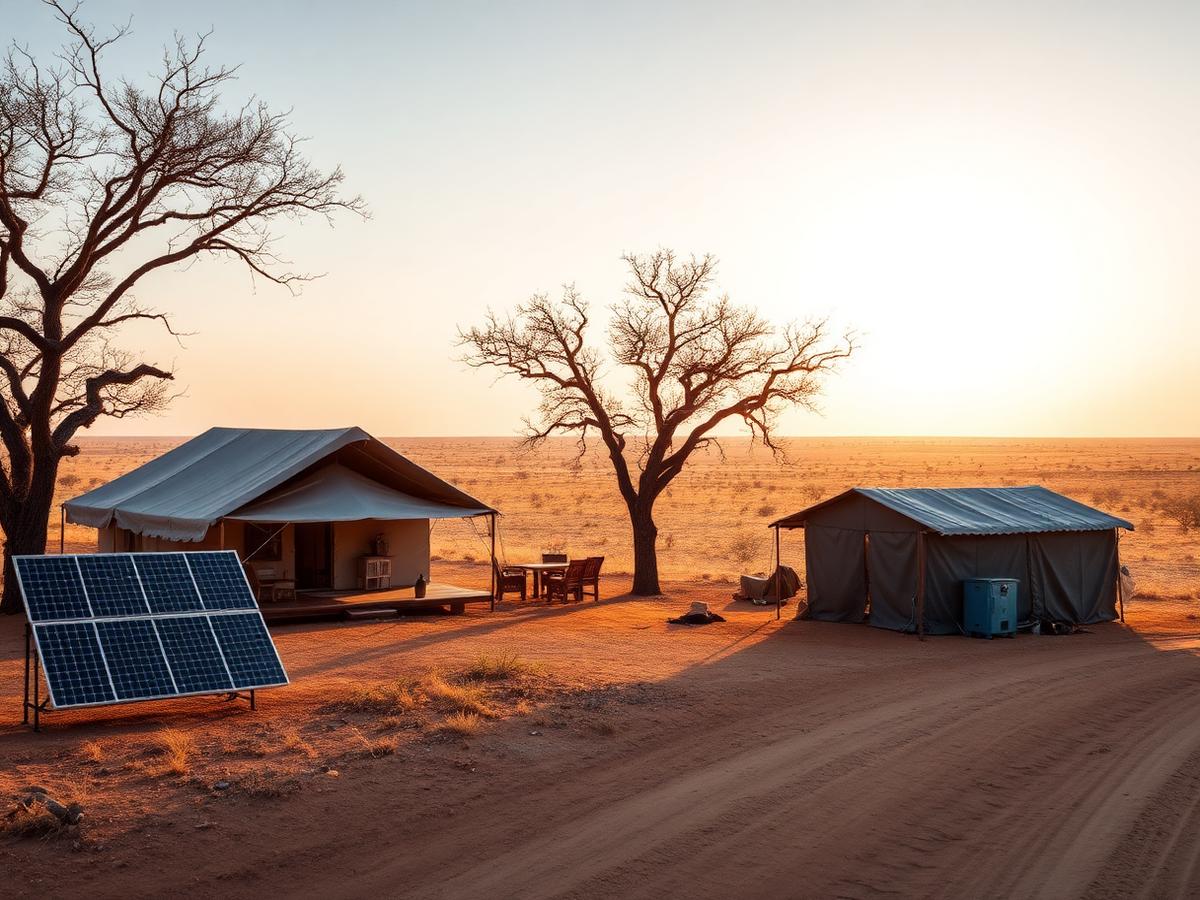
Lodge B
Off-grid · remote · 12 beds
11.2 kgCO₂e / guest bed night
The reveal
Lodge A has the lower carbon footprint. But that alone doesn't tell us which operation is performing better. Against comparable off-grid camps, Lodge B is a top-quartile performer. Against comparable grid-connected lodges, Lodge A is unremarkable.
The number tells you the footprint. The right comparison tells you what it means.That's where ETC Africa adds value. We give environmental data the context needed to become useful intelligence.Benchmarking
See where your property sits alongside relevant tourism operations. Different businesses operate differently, so we compare like with like.
Carbon intensity — off-grid safari lodges
kgCO₂e / guest bed night
Already have carbon data? We can help place it in the right tourism context. Starting from scratch? We can build the picture with you.
Talk to UsIllustrative distribution and values only. Not actual ETC Africa benchmark results.
Benchmarking
The right comparison shows what is working, what deserves attention and where to investigate further.
Total carbon
Your property
14.6 kgCO₂e
22% below
Diesel
Your property
7.2 L
29% below
Renewable energy
Your property
68% renewable
Top quartile
Waste
Your property
0.48 kg
39% below
Illustrative prototype values only. These figures do not represent actual ETC Africa benchmark results.
Operational intelligence
We work with your team to investigate unusual consumption, record-keeping gaps, infrastructure performance and cost-saving opportunities. Sometimes the answer is an investment. Sometimes it is a process change. Sometimes the data itself needs fixing.
Operational inefficiencies
Data quality problems
Year-on-year anomalies
Investment priorities
LPG consumption
kg / guest bed night
Your property
4.8 kg
Comparable properties
1.9 kg
Worth investigating
Kitchen equipment, hot-water systems and purchasing records.
Potential opportunity
≈ R120,000 annual savingif consumption moved towards peer best practiceIllustrative comparison
ETC Tourism Intelligence
A growing benchmarking dataset helps tourism businesses compare performance with relevant operational peers. The principle is simple: compare like with like.
93 tourism assessments · 400,000+ guest bed nights analysed · 1,000+ environmental datapoints
Property-level environmental assessments across multiple reporting periods.
Emissions sources we can benchmark
Portfolio support
For lodge and hotel groups, the most useful comparison is often inside the business itself. ETC helps groups compare properties on a like-for-like basis, identify internal best practice and focus management attention where it matters most.
The goal isn't to rank properties for the sake of it. It's to learn from what is working.
Explore Portfolio SupportQuestions your portfolio can answer
Credible communication
Tourism businesses are being asked more often to show the evidence behind environmental claims — by guests, agents, tour operators, investors and regulators. European consumer rules are also moving firmly in this direction. From September 2026, new EU rules restrict vague claims such as “green” or “environmentally friendly” where they cannot be demonstrated.
If you say it, be able to show it.
ETC helps tourism businesses build the measurement, evidence and context behind credible environmental communication.
Learn About Verified ImpactRequirements differ between markets and businesses. ETC provides environmental measurement and evidence support rather than legal advice.
Evidence & Recognition
Measuring your footprint is the starting point. ETC Africa turns operational data into a credible climate-performance assessment, showing not only your carbon intensity, but how reliable the evidence is, how you compare with similar tourism operations and whether performance is changing.
Through the Eco Travel Foundation Climate Performance Programme, that assessment can also provide recognition through an independent foundation-led programme, giving tourism businesses a credible way to support environmental claims with evidence rather than promises.
Four things become visible:
What is your measured footprint per occupied bed-night?
Can we trust the picture?
How do you compare?
Are you improving?
Want to go further? The Eco Travel Foundation is developing an optional certification pathway that will add independent conformity review and a separate certification decision.
Start with evidence
You don't need perfect data to start. We help make sense of what is already there, compare it with the right tourism operations and work with your team on what happens next.
Talk to UsVerified Impact is a programme of the Eco Travel Foundation, with technical assessment and benchmarking by ETC Africa.