

What we do

Start with where you are.

Whether you have years of environmental reporting or a collection of invoices, spreadsheets and operational records, ETC Africa helps turn what you already have into credible carbon and environmental intelligence.

You do not need perfect data. You do not need to know which service you need. You just need a sensible place to begin.

  1. Measure
  2. Benchmark
  3. Improve
  4. Prove

93 tourism assessments · 400,000+ guest bed nights · 1,000+ environmental datapoints

Core capabilities

What ETC Africa actually does.

We measure environmental impact, put performance into context and help tourism businesses understand what to do next.

Carbon footprints & GHG inventories

Establish credible Scope 1, Scope 2 and relevant Scope 3 baselines.

Environmental benchmarking

Compare carbon and operational performance with relevant tourism peers.

Operational performance analysis

Investigate unusual consumption, variances, inefficiencies and data-quality problems.

Portfolio intelligence

Compare properties, identify outliers and understand where attention or investment will matter most.

Reduction & improvement

Develop practical priorities, reduction pathways and performance tracking.

Credible communication

Support evidence-backed reporting, buyer information and Verified Impact participation.

A practical start

Start with what exists. Improve it as you go.

Real-world environmental data is rarely perfect. Fuel records disagree. Invoices go missing. Waste figures are incomplete. Different properties record the same information in different ways.

That does not mean you cannot begin. It means the first step is understanding what exists, what is reliable, what is estimated and what needs to improve.

01

What exists?

Invoices, accounts, fuel records, utility data, occupancy information and operational knowledge.

02

What can we use?

Identify reliable evidence, reasonable estimates and obvious gaps.

03

What can we build?

Create the best credible baseline the available evidence supports.

04

What should improve?

Strengthen records and systems so future assessments become easier and more confident.

Better environmental information is one of the outcomes — not an entrance requirement.

“Some clients arrive with an ESG dashboard. Others arrive with a slightly terrifying folder called ‘Diesel’. Both are workable.”

Duncan Pritchard — ETC Africa

Three common starting points

What are you trying to understand?

Almost every tourism business we work with begins in one of three places.

01Establish a baseline

We don't really know our footprint yet.

Start with operational and financial information and build a credible carbon baseline.

Emissions by scope

Scope 132%
Scope 218%
Scope 350%

Total

412 tCO₂e

Intensity

14.6 kgCO₂e / guest bed night

Illustrative values only

02Understand performance

We already measure, but we don't know what the numbers mean.

Benchmark performance, investigate unusual results and identify practical opportunities.

Carbon intensity

22% below benchmark
Your property14.6

kgCO₂e / guest bed night

Comparable properties18.7

kgCO₂e / guest bed night

Illustrative values only

03See the portfolio

We manage several properties and need the bigger picture.

Compare performance across operations, identify outliers and prioritise attention or investment.

Portfolio carbon intensity

kgCO₂e / guest bed night

Property A9.8
Property B14.2
Property C18.7
Property DInvestigate31.4
Portfolio median: 16.5 kgCO₂e / GBN

Illustrative values only

This is not an environmental raid

We are not here to catch you out.

The purpose is not to arrive with clipboards, interrogate the lodge manager and go looking for something embarrassing under the desks.

The purpose is to work with your team, understand how the operation functions and build the clearest picture the available evidence reasonably supports.

Practical

We work with the systems and records that actually exist.

Collaborative

Your operational knowledge matters as much as the spreadsheet.

Transparent

Estimates and uncertainties are identified rather than disguised.

Progressive

Each assessment should make the next one easier, stronger and more useful.

“We don’t need perfect data. We do need to know which bits aren’t perfect.”

Duncan Pritchard — ETC Africa

From reporting to management

The report isn't the outcome.

The inventory is the foundation. Its real value comes from using the underlying information to understand operations, improve evidence and make better decisions.

01

Reporting

“What did we emit?”

02

Benchmarking

“How do we compare?”

03

Intelligence

“Why are we different?”

04

Management

“What should we do about it?”

“A carbon footprint shouldn’t disappear into a PDF once a year.”

Duncan Pritchard — ETC Africa

Tourism operating context

Tourism isn't a factory. And a safari lodge isn't an office building.

Occupancy, generators, game drives, staff accommodation, remote logistics, full-board kitchens, solar systems, water infrastructure and seasonality all affect environmental performance.

Meaningful analysis requires understanding how the operation actually works.

“If a number looks odd, good. That is usually where the useful questions begin.”

What shapes the numbers

  • Occupancy

    Guest bed nights drive nearly every intensity metric.

  • Off-grid power

    Generators, solar and battery systems in constant negotiation.

  • Game drives

    Vehicle fuel that no office building will ever report.

  • Remote logistics

    Long supply runs, charter flights, seasonal resupply.

  • Full-board kitchens

    LPG, cold chain and food volumes tied to guest numbers.

  • Water & waste

    Boreholes, treatment plants and on-site disposal infrastructure.
How the process works

We make the process manageable.

01

Have a conversation

Tell us what you are trying to understand and what information currently exists.

02

Gather what is available

Invoices, accounts, utility information, fuel records, occupancy data and relevant operational knowledge.

03

Build the best credible baseline

Calculate the inventory, document assumptions and identify evidence gaps.

04

Compare and investigate

Put performance into context and explore what is driving important results.

05

Improve the information and the operation

Strengthen data systems, prioritise practical action and track change over time.

The first assessment does not need to be the final word. It needs to be an honest and useful starting point.

Better data is part of the outcome

The process improves more than the carbon number.

A first assessment often reveals where environmental information is strong, where it is uncertain and how future reporting can become easier. Data confidence can improve alongside environmental performance.

“Sometimes the sustainability finding is excellent performance. Sometimes it is a broken meter. Both are useful things to know.”

Duncan Pritchard — ETC Africa
01Scattered information
02Credible baseline
03Visible data gaps
04Better records
05Stronger benchmarking
06Better decisions
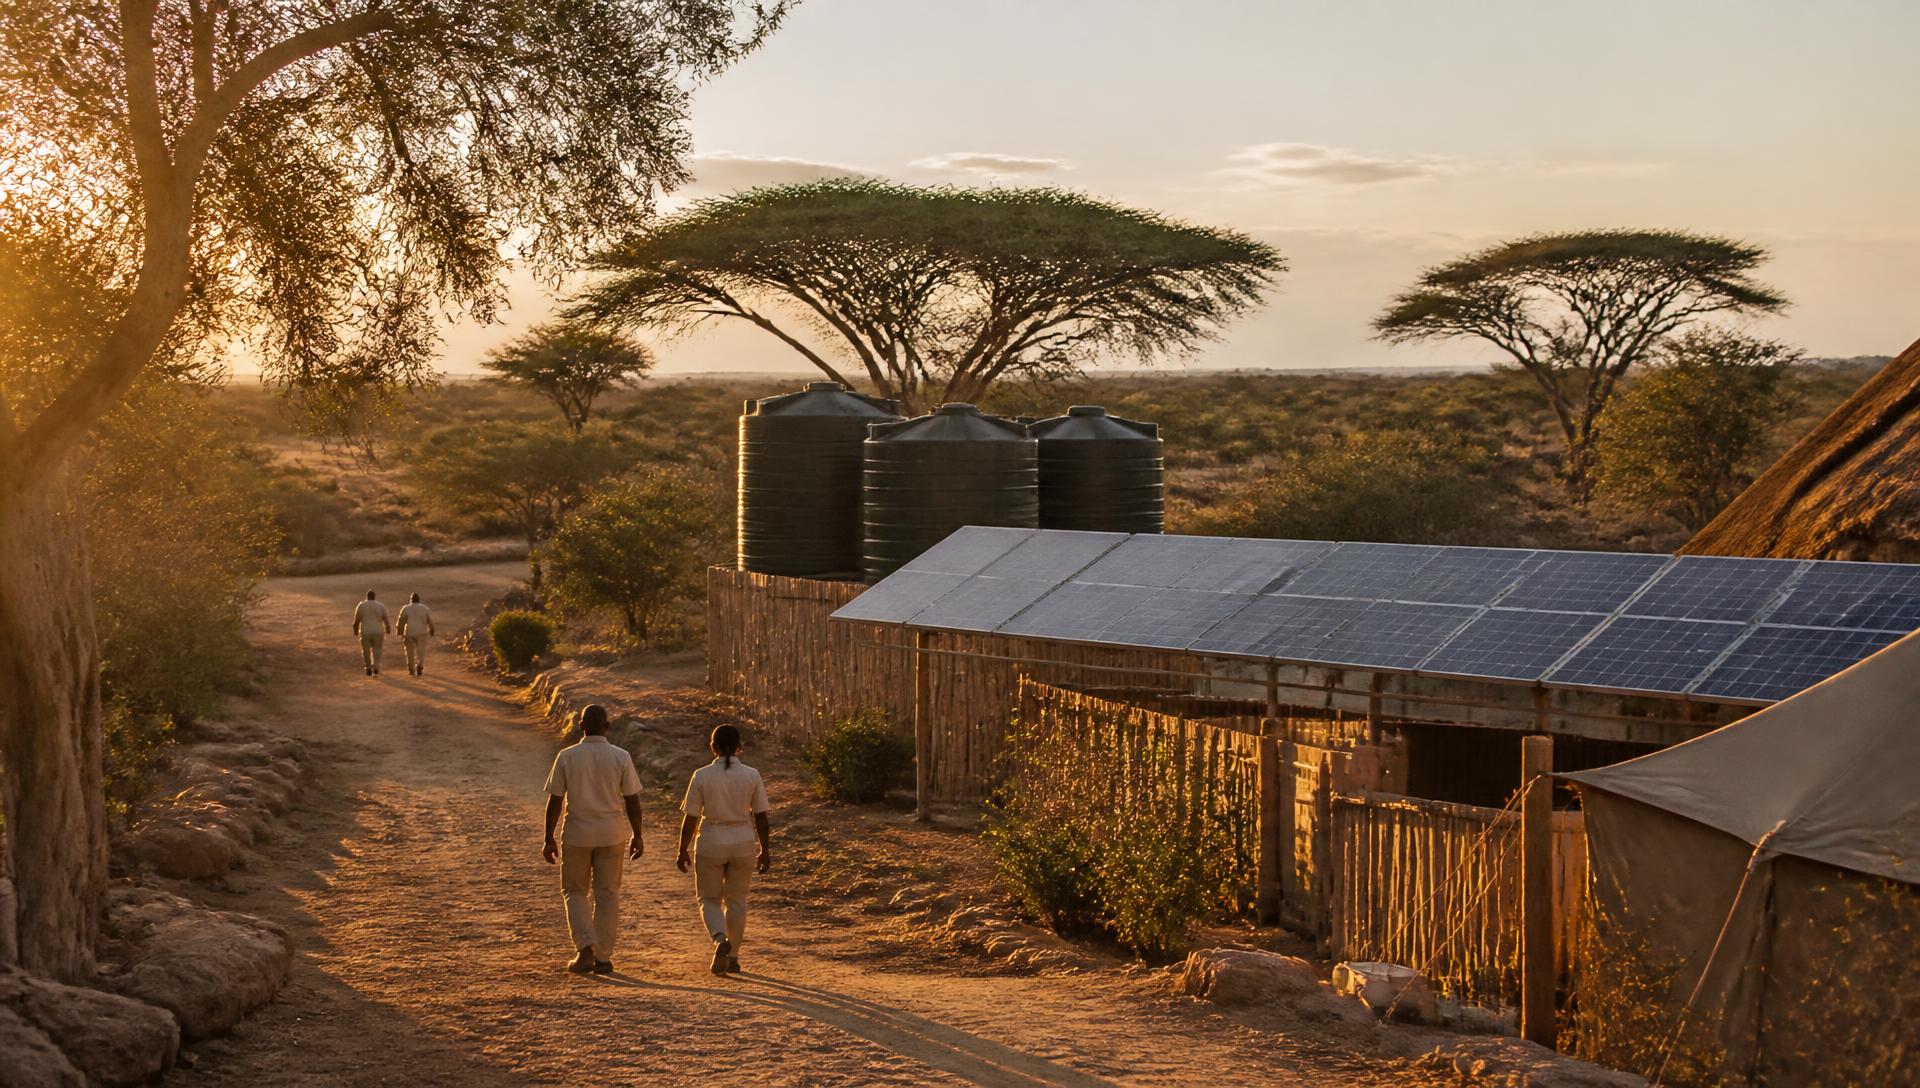
Solar array and water tanks behind an off-grid safari camp at golden hour

Bring us what you have. We'll start there.

You do not need a finished sustainability system, a perfect spreadsheet or complete confidence in every number. Tell us what you are trying to understand and we will help work out the sensible next step.